
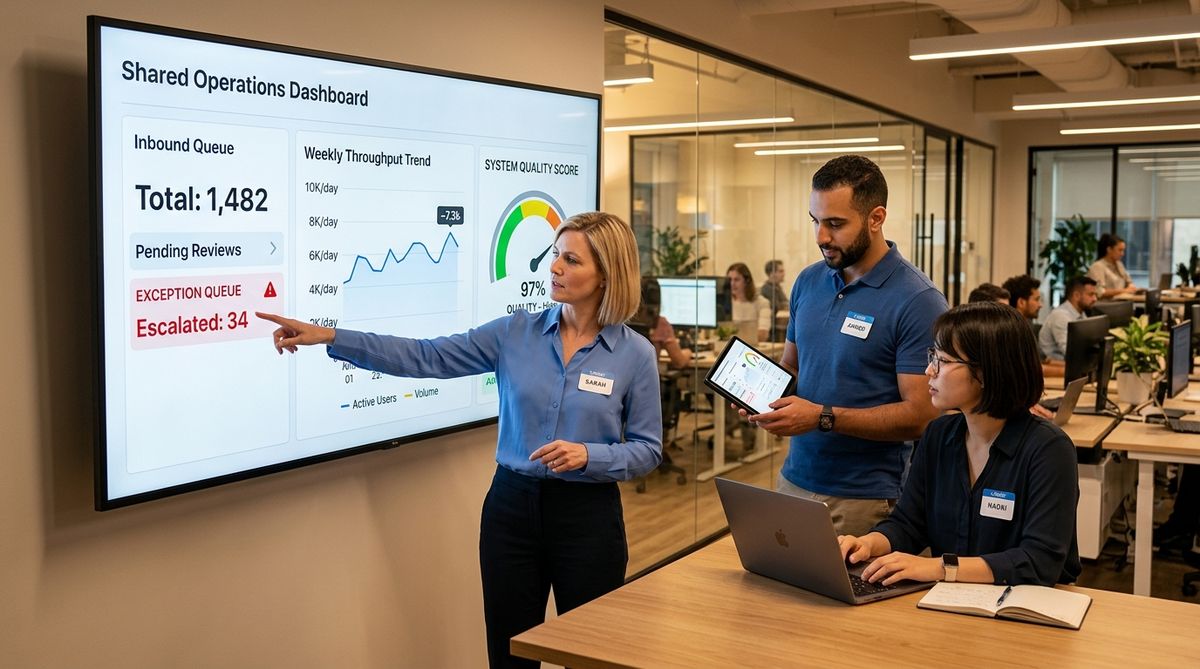
A single view for approvals, exceptions, and quality.
The Control Tower keeps leaders and operators aligned with a shared inbox, capacity dashboard, and audit-ready evidence.
Capacity returned
312 hrs
last 30 days
Exceptions
7%
below target
Automation rate
89%
end-to-end
Quality score
98%
rubric based
Inbox
Exceptions and approvals stay visible
Operators see what needs attention first, while leaders track throughput and risk exposure.
Evidence panel
Every decision includes evidence snapshots, approvals history, and a reproducible trail. Policy checks, decision logs, and approve/reject actions are all captured.
Views by role
A shared source of truth
Every stakeholder gets the view they need without losing alignment on the workflow state.
Ops lead view
Backlog health, SLA risk, and escalation volume.
Operator view
Prioritized queue with evidence and next actions.
Compliance view
Audit trail, approvals history, and evidence packs.
Alerting
Signals before problems spread
The Control Tower flags early warning signals so teams can intervene before backlog or quality slips.
Next step
See the Control Tower live
We can mock your workflow in the Control Tower during discovery.